Over the last 40 years, obesity rates around the world have ballooned.
The average adult today is 3x as likely to be obese compared to the average adult in 1975.
This map shows how it happened, country-by-country.
The color of each county represents its adult obesity rate in the year shown.
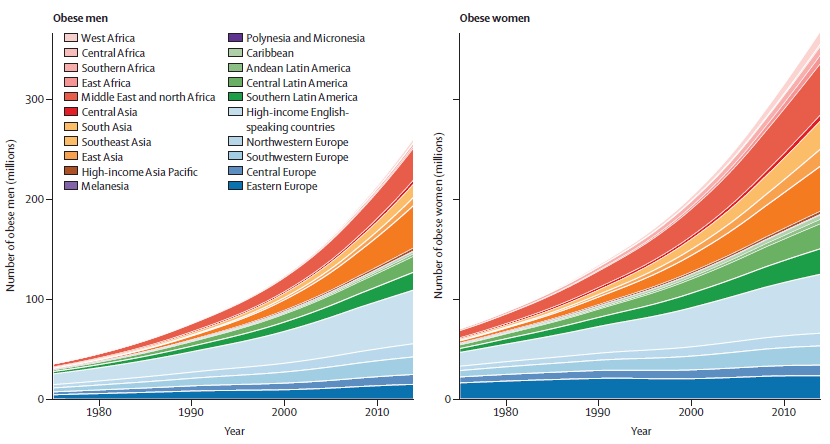
Researchers compiled data from 1,698 obesity-related studies, covering 19.2 million people in 186 countries.
They then used the information to estimate the distribution of body mass index (BMI) for every country in the world, for every year from 1975 to 2014.
Between 1975 and 2014, the study estimates that worldwide age-standardized obesity rates (defined as a BMI of 30 or greater) increased from 3.2% to 10.8% for men, and from 6.4% to 14.9% for women.